Sea Level Rise

The ocean rose 5.9 millimetres in 2024, above the recent trend. Atlantic Canada, sinking as seas rise, could see a metre by 2100. A major Fraser flood could cost $20 to $30 billion. That exposure is being built and financed now, at conditions the assets were never designed for.

Share
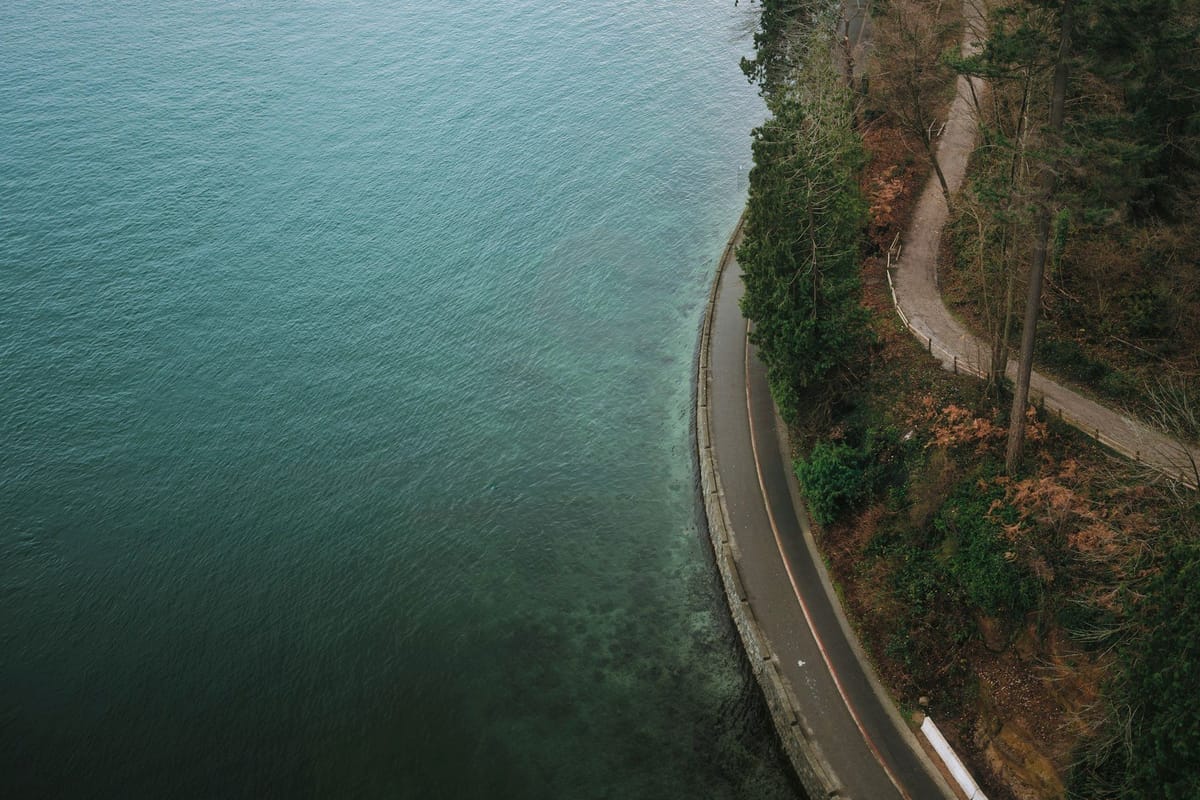
Aerial view of a winding coastal road between turquoise water and a densely wooded shoreline.
Photo by Albert Stoynov / Unsplash

A few weeks ago I walked the grounds at the Fortress of Louisbourg, on the Atlantic coast of Cape Breton. The fortress dates to the early eighteenth century, its walls built mainly between 1720 and 1740, when the sea sat lower against the shore than it does today. Just past the east gate is Rochefort Point, a narrow peninsula holding a burial ground with as many as a thousand of the settlement’s dead. It has lost about half its area to the ocean. Since 2016, Parks Canada and archaeologists from the University of New Brunswick have been excavating those graves to move the remains inland before the sea reaches them. When post-tropical storm Fiona crossed the coast in 2022, it stripped metres of soil from the shoreline in places and exposed two sets of eighteenth-century remains, and the team was down on the point doing emergency recovery.

That is sea level rise as it actually happens. Not a projection for 2100, but a work crew carrying three-hundred-year-old bones inland ahead of the water. At Louisbourg the asset being lost is heritage. Everywhere else along the coast it is infrastructure, insured property, and the assessed value of land, and the loss is already underway.

The ocean is rising for two reasons that operate at once and reinforce each other. As ocean water absorbs heat it expands, a process called thermal expansion that adds volume without adding mass. As land-based ice melts, from glaciers, from the Greenland ice sheet, from Antarctica, it transfers mass that was stored on land into the ocean, raising sea levels everywhere. The rate of rise has been accelerating. Between 1993 and 2024 the global average rate was 3.4 millimetres per year. Between 2015 and 2024 it was 4.7 millimetres per year. In 2024 alone, sea levels rose 5.9 millimetres, above even the recent accelerated trend. Under moderate emissions scenarios, IPCC projections suggest global mean sea level will rise roughly half a metre by 2100 relative to recent baselines. Under high emissions the range extends to just over a metre. The 2050 numbers do not diverge dramatically by scenario, because much of the near-term rise is already locked in by the heat the ocean has absorbed. After 2050, the emissions path matters considerably more.

Global averages obscure local conditions that can be far more severe. Sea level rise is not uniform, because land itself moves. Where land is subsiding, relative sea level rise, what a shoreline actually experiences, is higher than the global mean. Where post-glacial rebound is lifting land, relative rise can be lower or even negative. This distinction matters enormously for how Canada reads its own exposure. Atlantic Canada sits on land that is subsiding while global sea levels rise, producing some of the highest relative sea level rise rates in the country. CLIMAtlantic projects approximately one metre of sea level rise for Atlantic Canada by 2100 and two metres or more by 2150, with higher outcomes possible under severe ice-sheet scenarios. Nova Scotia, New Brunswick, and Prince Edward Island face a combination of eroding shorelines, sinking land, and intensifying storm surge that makes them among the most exposed coastal regions in the country.

The Fraser River delta compounds the same problem through a different mechanism. Land in Richmond and Delta is subsiding at roughly one to two millimetres per year through the natural settling of river sediment, adding to global sea level rise instead of offsetting it. British Columbia advises municipalities in the region to plan for one metre of sea level rise by 2100. Combined with projected subsidence, the effective change in relative sea level that coastal infrastructure in the Lower Mainland must be designed around is closer to 1.2 metres over the same period. A major Fraser River or coastal flood event is estimated to cause between $20 and $30 billion in losses, potentially the largest natural disaster in Canadian history. The infrastructure sitting within that risk envelope, roads, rail, wastewater systems, airports, residential and industrial development, was built around assumptions about flood frequency and sea level that are being revised upward in real time.

Arctic Canada presents a different configuration. Some northern coastlines are rising through post-glacial rebound, as land that was depressed under glacial ice continues to recover. But the Beaufort Sea region faces subsidence, permafrost thaw, and coastal erosion at rates that are severe and accelerating. Arctic coastlines are eroding by up to 40 metres per year in some locations. Erosion rates on permafrost coasts in the Canadian and American Beaufort Sea increased by 80 to 160 percent when recent decades are compared with the late twentieth century. For communities built on permafrost coasts, managed retreat is a near-term physical reality, not a distant policy question. The infrastructure serving those communities, the fuel storage, the water systems, the housing, faces conditions that conventional engineering standards were not designed to accommodate.

The numbers that describe sea level rise sound small until the sensitivity of coastal systems to small vertical changes is understood. A rise of 20 or 30 centimetres does not by itself inundate a coastline. What it does is change the baseline from which storm surges operate. An event that previously occurred once every hundred years on a lower baseline becomes a more frequent event on a higher one. Drainage systems designed for historical rainfall and tidal conditions begin to fail more often as the margin between high tide and drain capacity narrows. Saltwater intrudes into coastal aquifers and agricultural land. Infrastructure built to a comfortable margin above the historical flood line finds that margin reduced before any single dramatic event has occurred. Sea level rise becomes financially real before it becomes visually dramatic. It shows up first in flood maps, insurance terms, drainage system performance, municipal budgets, and the slow reclassification of land once assumed to be safe.

The insurance dimension is where that financial reality is becoming most visible in Canada. The Canadian Climate Institute reported in 2025 that 1.5 million Canadian homes, roughly 10 percent of all housing, are at high risk of flooding and currently lack flood insurance. Private flood insurance payouts have averaged nearly $800 million annually over the past decade. Insurers have raised premiums, tightened underwriting standards, and in some cases withdrawn from high-risk areas as severe weather risk has increased. The trajectory of comparable markets is instructive. Florida’s insurer of last resort grew by 277 percent between 2017 and 2022, reaching $423 billion in insured value as private insurers reduced coastal exposure. Canada has not reached that point, but the direction of travel is the same. When private insurance becomes unavailable or unaffordable, the risk transfers to homeowners who cannot sell, to municipalities whose tax bases are tied to properties losing value, and to governments that become implicit insurers of last resort without the premium income to fund the role.

The municipal infrastructure dimension is less visible and equally consequential. Seawalls, dikes, wastewater systems, stormwater drainage, and coastal roads were built to standards based on historical sea levels and storm frequencies. Upgrading that infrastructure to standards appropriate for mid-century and end-of-century conditions is an asset management problem as much as an environmental one, and it is arriving inside the normal replacement cycle of assets being maintained and upgraded right now. Between 320,000 and 600,000 Canadians currently occupy land exposed to sea level rise and coastal flooding, a figure that rises to between 480,000 and 840,000 by 2100 under high emissions scenarios. The infrastructure serving those populations represents capital investment decisions being made today, much of it without full accounting for how the physical conditions those assets will operate within will change over their useful lives.

Adaptation is already underway, though unevenly. Vancouver’s coastal planning assumes 50 centimetres of rise by mid-century and one metre by 2100, with the Fraser River foreshore identified as the city’s most flood-exposed area. Seawalls are being raised. Flood maps are being revised. Some municipalities are beginning to incorporate managed retreat, the planned relocation of structures and communities away from high-risk coastal areas, into their long-term planning frameworks. British Columbia’s 2024 Flood Strategy engagement materials discuss community-led managed retreat as an emerging policy area. The political difficulty of managed retreat is real. It requires governments to tell communities that the land they occupy will not be defended indefinitely, a message that sits poorly within electoral cycles measured in years and infrastructure investments measured in decades.

The deeper difficulty is one of time. Sea level rise unfolds across timescales that exceed election cycles, mortgage terms, quarterly earnings, and most infrastructure budgeting horizons. Assets being built today along Canadian coastlines are designed to last 50, 75, or 100 years. The sea level conditions those assets will encounter in the second half of their useful lives are materially different from the conditions they are being designed for now. That gap between the planning horizon implied by long-duration coastal investment and the physical trajectory of the coastline those investments occupy is not a future problem. It is a present miscalculation being made at scale, financed by capital that has not yet priced the full extent of what it is funding.

The coastline has always moved. What is changing now is the rate of that movement and the scale of the infrastructure built in its path.